camp assay buffer Search Results


90
Promega camp-glo lysis buffer
Camp Glo Lysis Buffer, supplied by Promega, used in various techniques. Bioz Stars score: 90/100, based on 1 PubMed citations. ZERO BIAS - scores, article reviews, protocol conditions and more
https://www.bioz.com/product/camp+assay+buffer/camp+glo+lysis+buffer/pm35809897-96-18-17
Average 90 stars, based on 1 article reviews
camp-glo lysis buffer - by Bioz Stars, 2026-10
90/100 stars
  Buy from Supplier

90
Harvard Bioscience development buffer containing 10 μ m latrunculin a and the specified concentrations of camp
Development Buffer Containing 10 μ M Latrunculin A And The Specified Concentrations Of Camp, supplied by Harvard Bioscience, used in various techniques. Bioz Stars score: 90/100, based on 1 PubMed citations. ZERO BIAS - scores, article reviews, protocol conditions and more
https://www.bioz.com/product/camp+assay+buffer/development+buffer+containing+10+%CE%BC+m+latrunculin+a+and+the+specified+concentrations+of+camp/pmc03944603-50-8-25
Average 90 stars, based on 1 article reviews
development buffer containing 10 μ m latrunculin a and the specified concentrations of camp - by Bioz Stars, 2026-10
90/100 stars
  Buy from Supplier

90
NEN Life Science camp assay buffer
Camp Assay Buffer, supplied by NEN Life Science, used in various techniques. Bioz Stars score: 90/100, based on 1 PubMed citations. ZERO BIAS - scores, article reviews, protocol conditions and more
https://www.bioz.com/product/camp+assay+buffer/camp+assay+buffer/pmc00122247-55-5-23
Average 90 stars, based on 1 article reviews
camp assay buffer - by Bioz Stars, 2026-10
90/100 stars
  Buy from Supplier

90
Promega camp-glo one buffer
( A , C , E ) Representative histograms from the flow cytometry analyses of cell surface binding of CTB (1 μg/mL) to control, KO, KO + OE, and dKO cell lines. Bar graph shows quantification of geometric mean fluorescence index (gMFI) from 3 independent trials, normalized to the maximum APC signal in control cells. Error bars indicate mean ± SD. ( B , D , F ) Control, KO, KO + OE, and dKO cell lines were incubated for 1.5 h with cholera holotoxin (CTX, 1 nM). Accumulation of <t>cAMP</t> was measured using the <t>cAMP-Glo</t> Max assay. Luminescence values were inversely proportional to cAMP levels. Total amount of plated cells was measured using the Cell Titer-Glo 2.0 assay. Data shown are inverse cAMP values normalized first to the total amount of cells plated for each cell line, then to the maximum signal in control cells. Each datapoint is a biological replicate consisting of 3 averaged technical replicates. Error bars indicate mean ± SD of 3 biological replicates. All statistical analyses were performed by one-way ANOVA with Tukey correction (* indicates p value between 0.01 and 0.05, ** 0.001 and 0.01, *** 0.001 and 0.0001, and **** <0.0001).
Camp Glo One Buffer, supplied by Promega, used in various techniques. Bioz Stars score: 90/100, based on 1 PubMed citations. ZERO BIAS - scores, article reviews, protocol conditions and more
https://www.bioz.com/product/camp+assay+buffer/camp+glo+one+buffer/bio_rxiv__2023__08__02__551727-291-24-10
Average 90 stars, based on 1 article reviews
camp-glo one buffer - by Bioz Stars, 2026-10
90/100 stars
  Buy from Supplier

90
DiscoverX corporation camp assay buffer
( A , C , E ) Representative histograms from the flow cytometry analyses of cell surface binding of CTB (1 μg/mL) to control, KO, KO + OE, and dKO cell lines. Bar graph shows quantification of geometric mean fluorescence index (gMFI) from 3 independent trials, normalized to the maximum APC signal in control cells. Error bars indicate mean ± SD. ( B , D , F ) Control, KO, KO + OE, and dKO cell lines were incubated for 1.5 h with cholera holotoxin (CTX, 1 nM). Accumulation of <t>cAMP</t> was measured using the <t>cAMP-Glo</t> Max assay. Luminescence values were inversely proportional to cAMP levels. Total amount of plated cells was measured using the Cell Titer-Glo 2.0 assay. Data shown are inverse cAMP values normalized first to the total amount of cells plated for each cell line, then to the maximum signal in control cells. Each datapoint is a biological replicate consisting of 3 averaged technical replicates. Error bars indicate mean ± SD of 3 biological replicates. All statistical analyses were performed by one-way ANOVA with Tukey correction (* indicates p value between 0.01 and 0.05, ** 0.001 and 0.01, *** 0.001 and 0.0001, and **** <0.0001).
Camp Assay Buffer, supplied by DiscoverX corporation, used in various techniques. Bioz Stars score: 90/100, based on 1 PubMed citations. ZERO BIAS - scores, article reviews, protocol conditions and more
https://www.bioz.com/product/camp+assay+buffer/camp+assay+buffer/us11858910-820-10-13
Average 90 stars, based on 1 article reviews
camp assay buffer - by Bioz Stars, 2026-10
90/100 stars
  Buy from Supplier

90
Promega camp-glo reaction buffer
( A , C , E ) Representative histograms from the flow cytometry analyses of cell surface binding of CTB (1 μg/mL) to control, KO, KO + OE, and dKO cell lines. Bar graph shows quantification of geometric mean fluorescence index (gMFI) from 3 independent trials, normalized to the maximum APC signal in control cells. Error bars indicate mean ± SD. ( B , D , F ) Control, KO, KO + OE, and dKO cell lines were incubated for 1.5 h with cholera holotoxin (CTX, 1 nM). Accumulation of <t>cAMP</t> was measured using the <t>cAMP-Glo</t> Max assay. Luminescence values were inversely proportional to cAMP levels. Total amount of plated cells was measured using the Cell Titer-Glo 2.0 assay. Data shown are inverse cAMP values normalized first to the total amount of cells plated for each cell line, then to the maximum signal in control cells. Each datapoint is a biological replicate consisting of 3 averaged technical replicates. Error bars indicate mean ± SD of 3 biological replicates. All statistical analyses were performed by one-way ANOVA with Tukey correction (* indicates p value between 0.01 and 0.05, ** 0.001 and 0.01, *** 0.001 and 0.0001, and **** <0.0001).
Camp Glo Reaction Buffer, supplied by Promega, used in various techniques. Bioz Stars score: 90/100, based on 1 PubMed citations. ZERO BIAS - scores, article reviews, protocol conditions and more
https://www.bioz.com/product/camp+assay+buffer/camp+glo+reaction+buffer/pm21984484-98-6-81
Average 90 stars, based on 1 article reviews
camp-glo reaction buffer - by Bioz Stars, 2026-10
90/100 stars
  Buy from Supplier

90
Enzo Biochem 0.1m hcl lysis buffer direct camp elisa kit
( A , C , E ) Representative histograms from the flow cytometry analyses of cell surface binding of CTB (1 μg/mL) to control, KO, KO + OE, and dKO cell lines. Bar graph shows quantification of geometric mean fluorescence index (gMFI) from 3 independent trials, normalized to the maximum APC signal in control cells. Error bars indicate mean ± SD. ( B , D , F ) Control, KO, KO + OE, and dKO cell lines were incubated for 1.5 h with cholera holotoxin (CTX, 1 nM). Accumulation of <t>cAMP</t> was measured using the <t>cAMP-Glo</t> Max assay. Luminescence values were inversely proportional to cAMP levels. Total amount of plated cells was measured using the Cell Titer-Glo 2.0 assay. Data shown are inverse cAMP values normalized first to the total amount of cells plated for each cell line, then to the maximum signal in control cells. Each datapoint is a biological replicate consisting of 3 averaged technical replicates. Error bars indicate mean ± SD of 3 biological replicates. All statistical analyses were performed by one-way ANOVA with Tukey correction (* indicates p value between 0.01 and 0.05, ** 0.001 and 0.01, *** 0.001 and 0.0001, and **** <0.0001).
0.1m Hcl Lysis Buffer Direct Camp Elisa Kit, supplied by Enzo Biochem, used in various techniques. Bioz Stars score: 90/100, based on 1 PubMed citations. ZERO BIAS - scores, article reviews, protocol conditions and more
https://www.bioz.com/product/camp+assay+buffer/0+1m+hcl+lysis+buffer+direct+camp+elisa+kit/pmc05499706-191-8-12
Average 90 stars, based on 1 article reviews
0.1m hcl lysis buffer direct camp elisa kit - by Bioz Stars, 2026-10
90/100 stars
  Buy from Supplier

90
Merck KGaA camp assay buffer
( A , C , E ) Representative histograms from the flow cytometry analyses of cell surface binding of CTB (1 μg/mL) to control, KO, KO + OE, and dKO cell lines. Bar graph shows quantification of geometric mean fluorescence index (gMFI) from 3 independent trials, normalized to the maximum APC signal in control cells. Error bars indicate mean ± SD. ( B , D , F ) Control, KO, KO + OE, and dKO cell lines were incubated for 1.5 h with cholera holotoxin (CTX, 1 nM). Accumulation of <t>cAMP</t> was measured using the <t>cAMP-Glo</t> Max assay. Luminescence values were inversely proportional to cAMP levels. Total amount of plated cells was measured using the Cell Titer-Glo 2.0 assay. Data shown are inverse cAMP values normalized first to the total amount of cells plated for each cell line, then to the maximum signal in control cells. Each datapoint is a biological replicate consisting of 3 averaged technical replicates. Error bars indicate mean ± SD of 3 biological replicates. All statistical analyses were performed by one-way ANOVA with Tukey correction (* indicates p value between 0.01 and 0.05, ** 0.001 and 0.01, *** 0.001 and 0.0001, and **** <0.0001).
Camp Assay Buffer, supplied by Merck KGaA, used in various techniques. Bioz Stars score: 90/100, based on 1 PubMed citations. ZERO BIAS - scores, article reviews, protocol conditions and more
https://www.bioz.com/product/camp+assay+buffer/camp+assay+buffer/pm09363703-63-5-46
Average 90 stars, based on 1 article reviews
camp assay buffer - by Bioz Stars, 2026-10
90/100 stars
  Buy from Supplier

90
DuPont de Nemours camp ria buffer
( A , C , E ) Representative histograms from the flow cytometry analyses of cell surface binding of CTB (1 μg/mL) to control, KO, KO + OE, and dKO cell lines. Bar graph shows quantification of geometric mean fluorescence index (gMFI) from 3 independent trials, normalized to the maximum APC signal in control cells. Error bars indicate mean ± SD. ( B , D , F ) Control, KO, KO + OE, and dKO cell lines were incubated for 1.5 h with cholera holotoxin (CTX, 1 nM). Accumulation of <t>cAMP</t> was measured using the <t>cAMP-Glo</t> Max assay. Luminescence values were inversely proportional to cAMP levels. Total amount of plated cells was measured using the Cell Titer-Glo 2.0 assay. Data shown are inverse cAMP values normalized first to the total amount of cells plated for each cell line, then to the maximum signal in control cells. Each datapoint is a biological replicate consisting of 3 averaged technical replicates. Error bars indicate mean ± SD of 3 biological replicates. All statistical analyses were performed by one-way ANOVA with Tukey correction (* indicates p value between 0.01 and 0.05, ** 0.001 and 0.01, *** 0.001 and 0.0001, and **** <0.0001).
Camp Ria Buffer, supplied by DuPont de Nemours, used in various techniques. Bioz Stars score: 90/100, based on 1 PubMed citations. ZERO BIAS - scores, article reviews, protocol conditions and more
https://www.bioz.com/product/camp+assay+buffer/camp+ria+buffer/us07235366-1800-6-21
Average 90 stars, based on 1 article reviews
camp ria buffer - by Bioz Stars, 2026-10
90/100 stars
  Buy from Supplier

90
NEN Life Science camp ria kit buffer
( A , C , E ) Representative histograms from the flow cytometry analyses of cell surface binding of CTB (1 μg/mL) to control, KO, KO + OE, and dKO cell lines. Bar graph shows quantification of geometric mean fluorescence index (gMFI) from 3 independent trials, normalized to the maximum APC signal in control cells. Error bars indicate mean ± SD. ( B , D , F ) Control, KO, KO + OE, and dKO cell lines were incubated for 1.5 h with cholera holotoxin (CTX, 1 nM). Accumulation of <t>cAMP</t> was measured using the <t>cAMP-Glo</t> Max assay. Luminescence values were inversely proportional to cAMP levels. Total amount of plated cells was measured using the Cell Titer-Glo 2.0 assay. Data shown are inverse cAMP values normalized first to the total amount of cells plated for each cell line, then to the maximum signal in control cells. Each datapoint is a biological replicate consisting of 3 averaged technical replicates. Error bars indicate mean ± SD of 3 biological replicates. All statistical analyses were performed by one-way ANOVA with Tukey correction (* indicates p value between 0.01 and 0.05, ** 0.001 and 0.01, *** 0.001 and 0.0001, and **** <0.0001).
Camp Ria Kit Buffer, supplied by NEN Life Science, used in various techniques. Bioz Stars score: 90/100, based on 1 PubMed citations. ZERO BIAS - scores, article reviews, protocol conditions and more
https://www.bioz.com/product/camp+assay+buffer/camp+ria+kit+buffer/pm10849205-94-1-18
Average 90 stars, based on 1 article reviews
camp ria kit buffer - by Bioz Stars, 2026-10
90/100 stars
  Buy from Supplier

90
Meso Scale Diagnostics LLC camp kit components (msd) r92tc-2 (not including plates_ r60ae-1 tag labeled camp r93ba-4 read buffer y, with surfactant (4x))
( A , C , E ) Representative histograms from the flow cytometry analyses of cell surface binding of CTB (1 μg/mL) to control, KO, KO + OE, and dKO cell lines. Bar graph shows quantification of geometric mean fluorescence index (gMFI) from 3 independent trials, normalized to the maximum APC signal in control cells. Error bars indicate mean ± SD. ( B , D , F ) Control, KO, KO + OE, and dKO cell lines were incubated for 1.5 h with cholera holotoxin (CTX, 1 nM). Accumulation of <t>cAMP</t> was measured using the <t>cAMP-Glo</t> Max assay. Luminescence values were inversely proportional to cAMP levels. Total amount of plated cells was measured using the Cell Titer-Glo 2.0 assay. Data shown are inverse cAMP values normalized first to the total amount of cells plated for each cell line, then to the maximum signal in control cells. Each datapoint is a biological replicate consisting of 3 averaged technical replicates. Error bars indicate mean ± SD of 3 biological replicates. All statistical analyses were performed by one-way ANOVA with Tukey correction (* indicates p value between 0.01 and 0.05, ** 0.001 and 0.01, *** 0.001 and 0.0001, and **** <0.0001).
Camp Kit Components (Msd) R92tc 2 (Not Including Plates R60ae 1 Tag Labeled Camp R93ba 4 Read Buffer Y, With Surfactant (4x)), supplied by Meso Scale Diagnostics LLC, used in various techniques. Bioz Stars score: 90/100, based on 1 PubMed citations. ZERO BIAS - scores, article reviews, protocol conditions and more
https://www.bioz.com/product/camp+assay+buffer/camp+kit+components++msd++r92tc+2++++not+including+plates+++r60ae+1+++tag+labeled+camp++r93ba+4+++read+buffer+y++with+++++surfactant++4x++/us11255842-158-35-34
Average 90 stars, based on 1 article reviews
camp kit components (msd) r92tc-2 (not including plates_ r60ae-1 tag labeled camp r93ba-4 read buffer y, with surfactant (4x)) - by Bioz Stars, 2026-10
90/100 stars
  Buy from Supplier

90
DiscoverX corporation cell lysis/camp antibody buffer
( A , C , E ) Representative histograms from the flow cytometry analyses of cell surface binding of CTB (1 μg/mL) to control, KO, KO + OE, and dKO cell lines. Bar graph shows quantification of geometric mean fluorescence index (gMFI) from 3 independent trials, normalized to the maximum APC signal in control cells. Error bars indicate mean ± SD. ( B , D , F ) Control, KO, KO + OE, and dKO cell lines were incubated for 1.5 h with cholera holotoxin (CTX, 1 nM). Accumulation of <t>cAMP</t> was measured using the <t>cAMP-Glo</t> Max assay. Luminescence values were inversely proportional to cAMP levels. Total amount of plated cells was measured using the Cell Titer-Glo 2.0 assay. Data shown are inverse cAMP values normalized first to the total amount of cells plated for each cell line, then to the maximum signal in control cells. Each datapoint is a biological replicate consisting of 3 averaged technical replicates. Error bars indicate mean ± SD of 3 biological replicates. All statistical analyses were performed by one-way ANOVA with Tukey correction (* indicates p value between 0.01 and 0.05, ** 0.001 and 0.01, *** 0.001 and 0.0001, and **** <0.0001).
Cell Lysis/Camp Antibody Buffer, supplied by DiscoverX corporation, used in various techniques. Bioz Stars score: 90/100, based on 1 PubMed citations. ZERO BIAS - scores, article reviews, protocol conditions and more
https://www.bioz.com/product/camp+assay+buffer/cell+lysis+camp+antibody+buffer/pm21871882-76-11-15
Average 90 stars, based on 1 article reviews
cell lysis/camp antibody buffer - by Bioz Stars, 2026-10
90/100 stars
  Buy from Supplier

Image Search Results


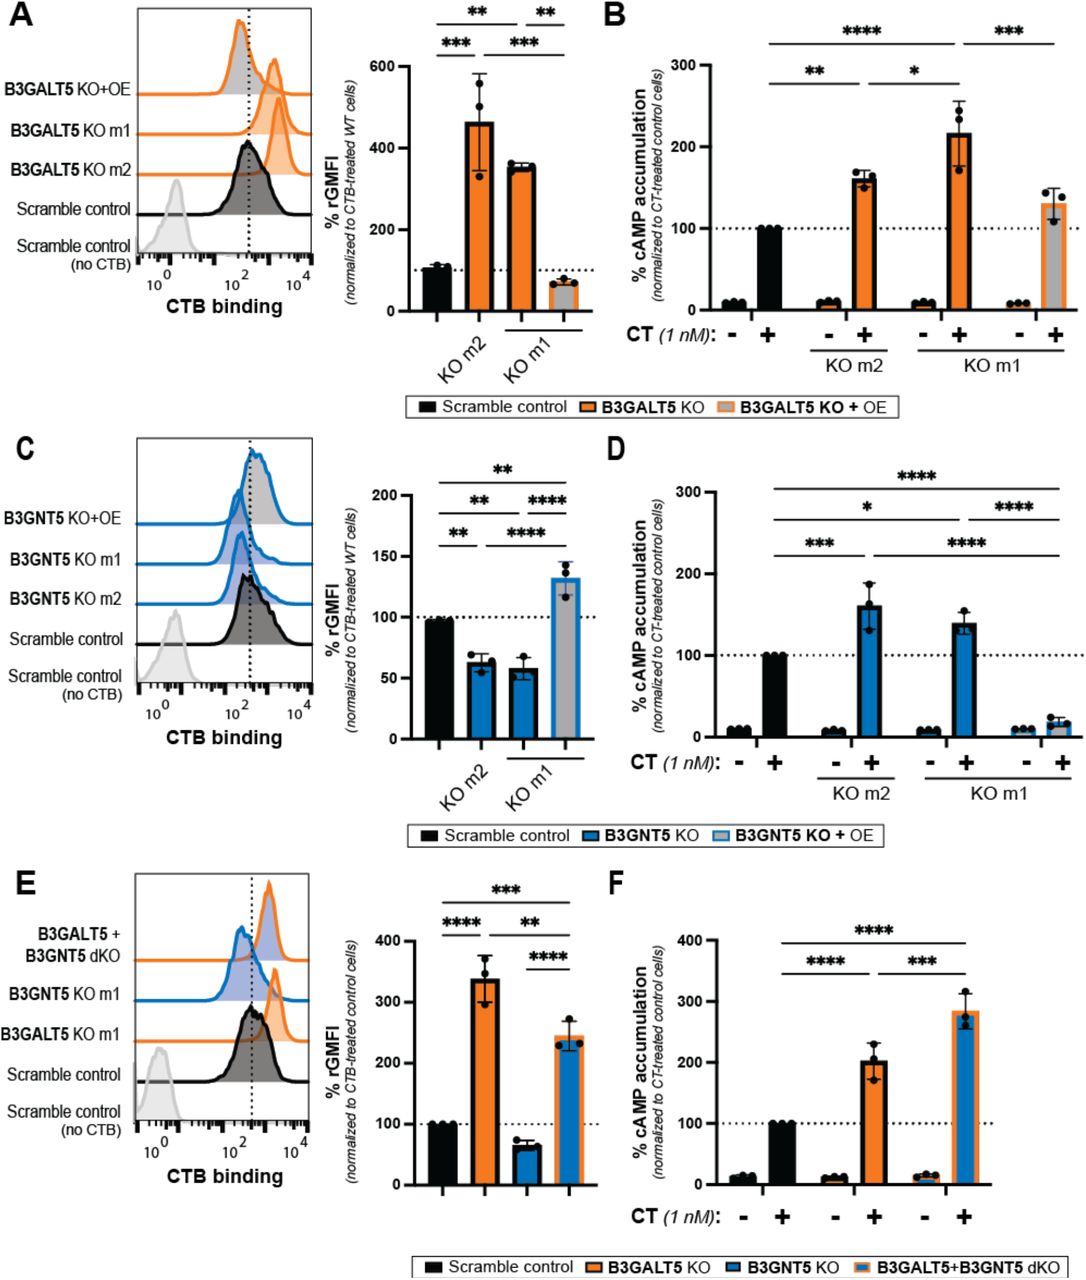
( A , C , E ) Representative histograms from the flow cytometry analyses of cell surface binding of CTB (1 μg/mL) to control, KO, KO + OE, and dKO cell lines. Bar graph shows quantification of geometric mean fluorescence index (gMFI) from 3 independent trials, normalized to the maximum APC signal in control cells. Error bars indicate mean ± SD. ( B , D , F ) Control, KO, KO + OE, and dKO cell lines were incubated for 1.5 h with cholera holotoxin (CTX, 1 nM). Accumulation of cAMP was measured using the cAMP-Glo Max assay. Luminescence values were inversely proportional to cAMP levels. Total amount of plated cells was measured using the Cell Titer-Glo 2.0 assay. Data shown are inverse cAMP values normalized first to the total amount of cells plated for each cell line, then to the maximum signal in control cells. Each datapoint is a biological replicate consisting of 3 averaged technical replicates. Error bars indicate mean ± SD of 3 biological replicates. All statistical analyses were performed by one-way ANOVA with Tukey correction (* indicates p value between 0.01 and 0.05, ** 0.001 and 0.01, *** 0.001 and 0.0001, and **** <0.0001).

Journal: bioRxiv

Article Title: Fucosylated glycoproteins and fucosylated glycolipids play opposing roles in cholera intoxication

doi: 10.1101/2023.08.02.551727

Figure Lengend Snippet: ( A , C , E ) Representative histograms from the flow cytometry analyses of cell surface binding of CTB (1 μg/mL) to control, KO, KO + OE, and dKO cell lines. Bar graph shows quantification of geometric mean fluorescence index (gMFI) from 3 independent trials, normalized to the maximum APC signal in control cells. Error bars indicate mean ± SD. ( B , D , F ) Control, KO, KO + OE, and dKO cell lines were incubated for 1.5 h with cholera holotoxin (CTX, 1 nM). Accumulation of cAMP was measured using the cAMP-Glo Max assay. Luminescence values were inversely proportional to cAMP levels. Total amount of plated cells was measured using the Cell Titer-Glo 2.0 assay. Data shown are inverse cAMP values normalized first to the total amount of cells plated for each cell line, then to the maximum signal in control cells. Each datapoint is a biological replicate consisting of 3 averaged technical replicates. Error bars indicate mean ± SD of 3 biological replicates. All statistical analyses were performed by one-way ANOVA with Tukey correction (* indicates p value between 0.01 and 0.05, ** 0.001 and 0.01, *** 0.001 and 0.0001, and **** <0.0001).

Article Snippet: Accumulated cAMP was measured using the cAMP-glo Max Assay Kit (Promega), according to manufacturer’s instructions with modification to incubation times (30 min incubation with cAMP-glo ONE buffer and 20 min incubation with the kinase-Glo buffer).

Techniques: Flow Cytometry, Binding Assay, Fluorescence, Incubation